
There is no single best time to post on Instagram: three large studies name 5 AM, Thursday at 9 AM and 8 PM. Use them to pick three candidate slots, then test those slots on your own account for six weeks and keep the one with the highest median views. The test below takes 18 posts and one spreadsheet.
What is the best time to post on Instagram according to the big studies?
The large studies give three different answers. Later reports 5 AM, Buffer reports Thursday at 9 AM, and Metricool reports 8 PM to 9 PM. All three analysed millions of posts. Later and Buffer state that their times are local; Metricool's article does not name a time zone. The gap comes mainly from what each one measured, and from whose posts they looked at.
| Study | Posts analysed | What it measured | Best time it reports |
|---|---|---|---|
| Later | Over 6 million feed posts, January to October 2024 | Engagement rate, in the audience's local time | 5 AM; 3 AM to 6 AM is above average every day |
| Buffer | 9.6 million posts, January 2024 to December 2025 | Median engagement rate (likes, comments, shares and saves divided by followers) | Thursday 9 AM, then Wednesday 12 PM and Wednesday 6 PM |
| Metricool | 24,364,803 posts from 375,118 accounts | Interactions by hour; the article gives no formula and no time zone | 6 PM to 9 PM, heaviest from 8 PM to 9 PM |
They also disagree about the worst time. Buffer reports 1 AM to 5 AM as the lowest-engagement hours on every day, and Metricool puts the low point at roughly 2 AM to 5 AM. Later's best window, 3 AM to 6 AM, overlaps both.
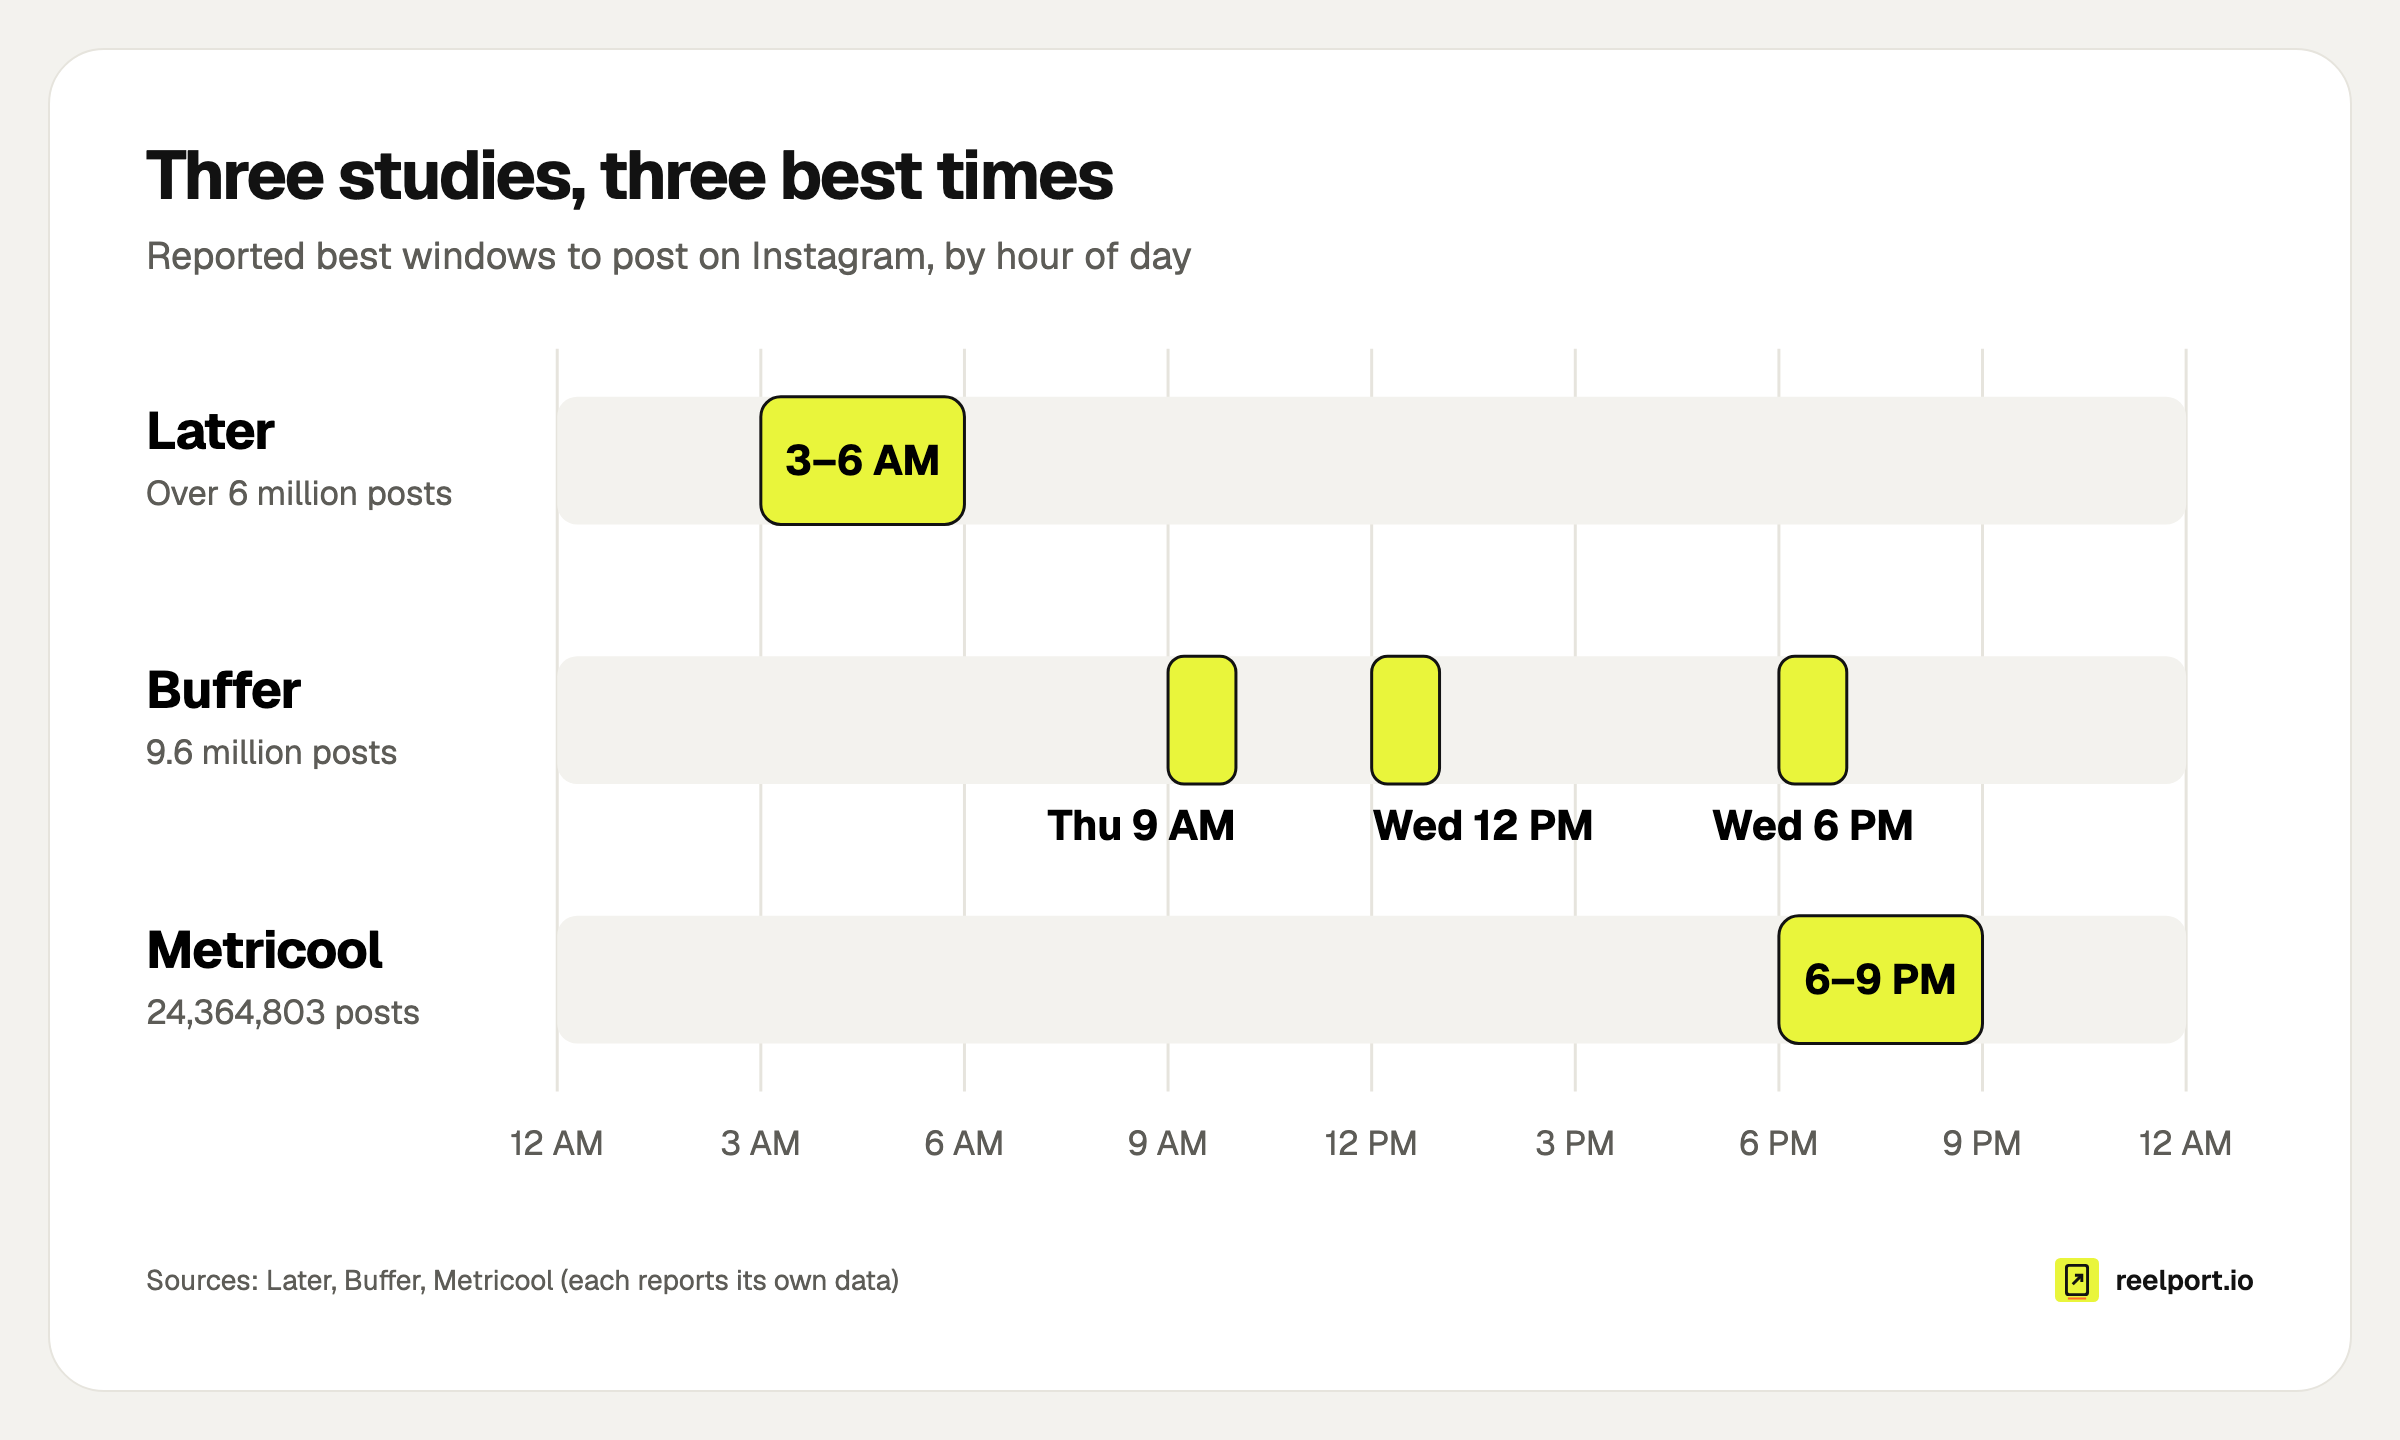
Three studies, three parts of the day: the reported best windows barely touch.
Why do the studies disagree?
They measure different things on different accounts. A study that counts total interactions per hour finds the hours when most people post and scroll. A study that divides engagement by followers, post by post, finds the hours when an individual post gets the most out of its audience. Those are separate questions with separate answers.
Metricool's own Reels numbers, which its article takes from its 2024 Short-Form Video Study, show the split. The most common upload hour in that data is 6 PM, with 119,705 Reels averaging 15,928 views. The highest average is at 12 AM: 25,159 views per Reel, on 34,131 uploads. The busiest hour and the best-performing hour are six hours apart in the same dataset.
Three more reasons the averages will not match your account:
- The sample is not your audience. Buffer's posts were all sent through Buffer. Later and Metricool do not say in their articles how the accounts were chosen. A sample heavy on brands with office-hours social teams behaves differently from one heavy on solo creators.
- Formats are mixed. Buffer analysed all post types together. Formats with different lifespans do not share a clock, and a mixed figure cannot tell you which format drove a slot.
- Niche and account size are averaged away. A bakery whose followers check Instagram before work and a gaming channel whose followers are online after midnight both end up in one global number.
So treat the studies as a list of hypotheses. Early morning, midday and evening each have a large dataset behind them, which makes them good candidates to test and poor answers to copy.
Where do you find your own most active times?
Instagram shows it in the app. Follower insights include the times your followers are most active, next to growth, top locations and age range, as listed in the Help Center's About Instagram insights. Open Insights in the Instagram app and look for the follower trends, which the Help Center lists under Total followers. Instagram shows them once you have at least 100 followers.
Read that chart for what it is: it tells you when your followers have the app open. It does not tell you which of your posts did well at which hour, and it says nothing about people who do not follow you yet. Use it to choose candidates. If the chart peaks at 7 AM and again from 6 PM to 9 PM, those two windows go on your shortlist, plus one slot from the studies that the chart does not suggest.
For the second half of the question, how your posts actually did by hour, you need post-level numbers lined up by publish time. Insights in reelport.io does this under "When your posts do best": hours and days in your time zone, each compared with that channel's usual result over the last 90 days. You can also build it by hand with the log further down.
How do you test the best time to post on Instagram for your account?
Pick three slots, post in each of them six times over six weeks, and compare the median views at the same post age. Rotate the slots across weekdays so that a strong Sunday does not pass for a strong hour. Keep format and topic mix steady, because a format change moves the numbers more than a time change does.
- Choose three candidate slots. One from your most active times, one from a study that contradicts it, one you already use. Space them at least four hours apart.
- Choose three posting days. For example Tuesday, Thursday and Sunday.
- Fix the format. Test Reels against Reels, carousels against carousels. Run a separate test per format if you post both.
- Rotate with the schedule below. After three weeks every slot has had every weekday once. Repeat for weeks four to six.
- Schedule the posts ahead. A test fails when a 7 AM post goes out at 7:40 because the morning got busy. Put the three slots into your posting schedule and let the queue publish on the minute.
- Read each post at the same age. Note views exactly 48 hours after publishing. A Tuesday post read on Friday and a Thursday post read on Friday are not comparable.
- Compare medians, not averages. One post that takes off will drag an average upwards and tell you nothing about the slot.
- Decide with a threshold. With six posts per slot, treat a gap under about 10% as noise. Keep the winner only if its median leads by more.
| Week | Tuesday | Thursday | Sunday |
|---|---|---|---|
| 1 and 4 | Slot A | Slot B | Slot C |
| 2 and 5 | Slot B | Slot C | Slot A |
| 3 and 6 | Slot C | Slot A | Slot B |
Copy this header into a spreadsheet and fill one row per post:
date,weekday,slot,publish_time,format,topic,views_48h,reach_48h,saves_48h,shares_48h,notes
2026-08-04,Tue,A,07:00,Reel,recipe,,,,,
2026-08-06,Thu,B,12:30,Reel,behind the scenes,,,,,
2026-08-09,Sun,C,19:30,Reel,recipe,,,,,
Use the notes column for anything that would explain an outlier: a collaboration post, a trending audio, a share by a bigger account. You will want to know that before you credit the hour.
What does a finished test look like?
Here is an invented example with round numbers: a café account in Hamburg with 8,400 followers, posting three Reels a week. It tested 07:00, 12:30 and 19:30 for six weeks and noted views after 48 hours. The account and all figures are illustrative.
| Slot | Views after 48 hours, six Reels | Average | Median |
|---|---|---|---|
| 07:00 | 1,850 · 1,950 · 2,100 · 2,250 · 2,400 · 9,800 | 3,392 | 2,175 |
| 12:30 | 2,450 · 2,600 · 2,750 · 2,800 · 2,900 · 3,100 | 2,767 | 2,775 |
| 19:30 | 2,700 · 2,950 · 3,150 · 3,300 · 3,450 · 3,600 | 3,192 | 3,225 |
The average says 07:00 wins with 3,392 views. That number is one Reel: the 9,800 was shared by a local news account, as the notes column shows. Take it out of the picture by using the median, the middle of the six values. For 07:00 that is (2,100 + 2,250) ÷ 2 = 2,175, for 12:30 it is (2,750 + 2,800) ÷ 2 = 2,775, and for 19:30 it is (3,150 + 3,300) ÷ 2 = 3,225.
By median, 19:30 leads 12:30 by 16% (3,225 ÷ 2,775 = 1.16) and 07:00 by 48% (3,225 ÷ 2,175 = 1.48). Both gaps clear the 10% threshold, so this account moves its Reels to 19:30 and retires the morning slot. Had the account copied an early-morning recommendation from a study, it would have picked its weakest hour.
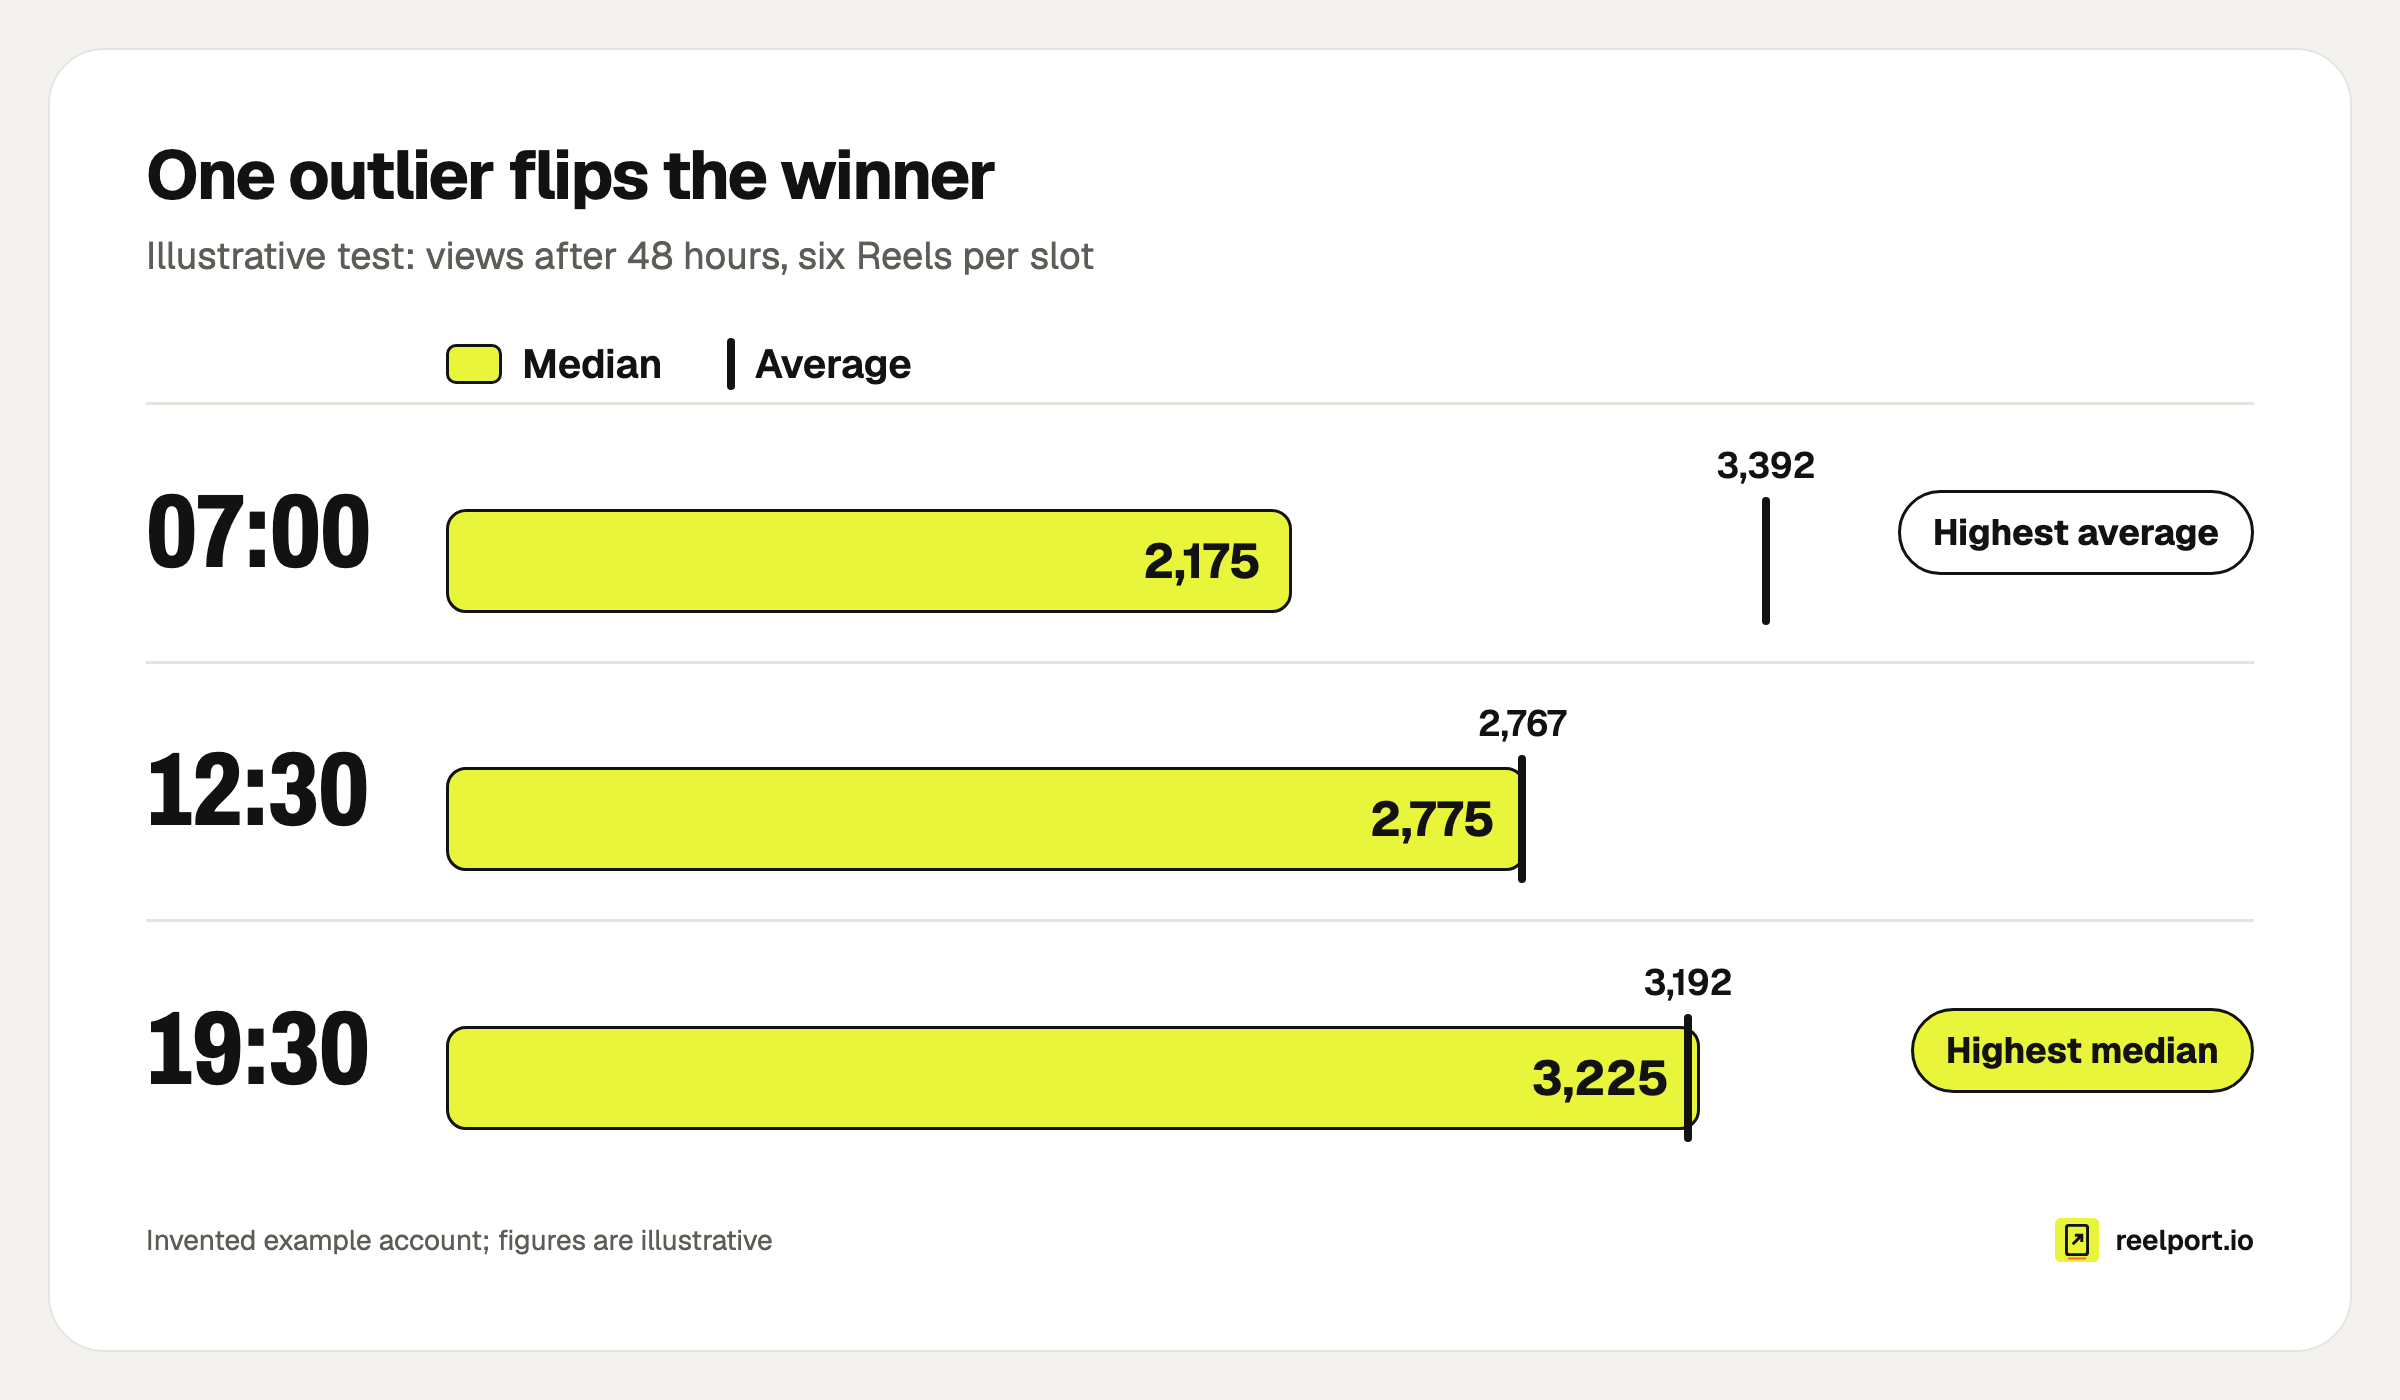
The average picks 07:00 because of one outlier; the median picks 19:30.
What if your followers live in different time zones?
Find the hours when your two largest groups are both awake and choose candidates inside that overlap. Top locations in Instagram's follower insights tell you where the groups are. Then convert one group's waking hours into your own clock and test only slots that fall inside both.
Another invented example: 55% of followers in Germany, 30% on the US East Coast. In August, Berlin is six hours ahead of New York. If you count 07:00 to 23:00 as waking hours, New York's 07:00 is 13:00 in Berlin, so both groups are awake from 13:00 to 23:00 Berlin time. A 07:00 Berlin post lands at 01:00 in New York and reaches the German 55% only. A 19:30 Berlin post lands at 13:30 in New York and can reach both.
Two details that catch people out:
- Schedule in your own time zone, think in theirs. Write both times in the log (19:30 Berlin, 13:30 New York) so you never have to recompute.
- The gap changes twice a year. The US and the EU switch clocks on different dates, so for two or three weeks in March and about one week at the turn of October to November, Berlin is five hours ahead of New York, not six. Check your slots when either side changes.
If your audience is spread over more than two zones with no clear majority, an overlap may not exist. Post twice: one slot per main region, with different content.
How often should you repeat the test?
Repeat it when something about the account changes: a new format, a new audience region, or a follower count that has roughly doubled. Otherwise twice a year is enough, and the clock changes in spring and autumn are a natural reminder. Between tests, keep one slot a month for an experiment at an untested hour.
Before you call a slot dead, check these:
- At least six posts in the slot, in one format
- Every post read at the same age
- Each weekday used equally often per slot
- No outliers left unexplained in the notes
- Median compared, gap larger than about 10%
- No holiday week or account outage in the period
Timing is a small lever next to the post itself. In the example above, the best slot lifted median views by 48% over the worst. A weak hook or an unclear first frame costs more than that at any hour, so settle the time once and put the saved attention into the content.
Where reelport.io fits
reelport.io covers the two mechanical parts of this. The posting schedule gives each Instagram channel its own time slots, so a test slot is a slot in the queue and posts publish from EU servers on the minute, with your computer off. Insights then shows when your posts do best by hour and day against the last 90 days, suggests best times next to the time picker, and exports posts with their numbers as CSV for your own log.
Insights is part of the paid plans, from Creator at $19 a month; the Free plan schedules posts without it. There is a 14-day Pro trial with no card on the pricing page. If you plan weeks ahead, the Contentplanner builds its plans on the same numbers.