
The Instagram analytics metrics worth tracking are reach, views, average watch time, skip rate and the four interactions (likes, comments, saves, shares), read as rates per account reached instead of raw totals. Views tell you how often a post was played, reach tells you how many accounts saw it, and the per-reach rates tell you whether those accounts cared. Everything else in Insights is context for those numbers.
Which Instagram analytics metrics matter most?
Three groups of Instagram analytics metrics carry almost every decision: distribution (reach and views), attention (average watch time and skip rate on reels) and response (likes, comments, saves and shares, each divided by reach). Follower count and total views describe size. The rates describe quality, and quality is what you can change.
Instagram itself points in the same direction. In January 2025, Social Media Today reported that Adam Mosseri named watch time, likes and sends as the three signals that matter most for ranking, and told creators to watch average watch time, likes per reach and sends per reach in their insights. According to the same report, likes weigh slightly more for content shown to followers and sends slightly more for content shown to people who do not follow you.
Note the "per reach". A reel with 500 likes from 8,000 accounts did better than one with 600 likes from 21,000, and only the rate shows it.
What does each Instagram metric mean?
Meta defines each metric in its developer documentation, and those definitions are the ones every analytics tool receives. Reach is the number of unique accounts that saw a post at least once and is an estimate. Views count plays, and Instagram's Help Center says they may include multiple views by the same accounts, where the same number of unique accounts is labelled Viewers. Total interactions are likes, saves, comments and shares added together.
| Metric | Meta's definition | Applies to | Watch out for |
|---|---|---|---|
| Views | Total number of times the post was played on Instagram | Feed posts, reels, stories | Several views by one account all count; views on ads are excluded |
| Reach | Unique accounts that saw the post at least once | Feed posts, reels, stories | An estimate |
| Likes, comments | Likes and comments on the post | Feed posts, reels | Ad interactions are excluded |
| Saved | Times the post was saved | Feed posts, reels | |
| Shares | Times the post was shared | Feed posts, reels, stories | |
| Total interactions | Likes, saves, comments and shares, minus unlikes, unsaves and deleted comments | Feed posts, reels, stories | |
| Average watch time | Average time spent playing the reel | Reels | Compare it with the reel's length |
| Skip rate | Share of initial views where the viewer skipped within the first 3 seconds | Reels | An estimate |
| Follows | Accounts that followed you from the post | Feed posts, stories | |
| Profile visits | Visits to your profile from the post | Feed posts, stories | |
| Navigation, replies, link clicks | Actions taken from the story; replies; taps on a link | Stories | Only available for 24 hours |
Source for every row: Instagram media insights, Meta for Developers. Account-level numbers such as accounts engaged and follower demographics are defined in Instagram account insights.
The pair people mix up most is reach and views. If five accounts see your reel and two of them watch it twice, reach is 5 and views are 7. Divide one by the other and you get views per reach: 7 ÷ 5 = 1.4.
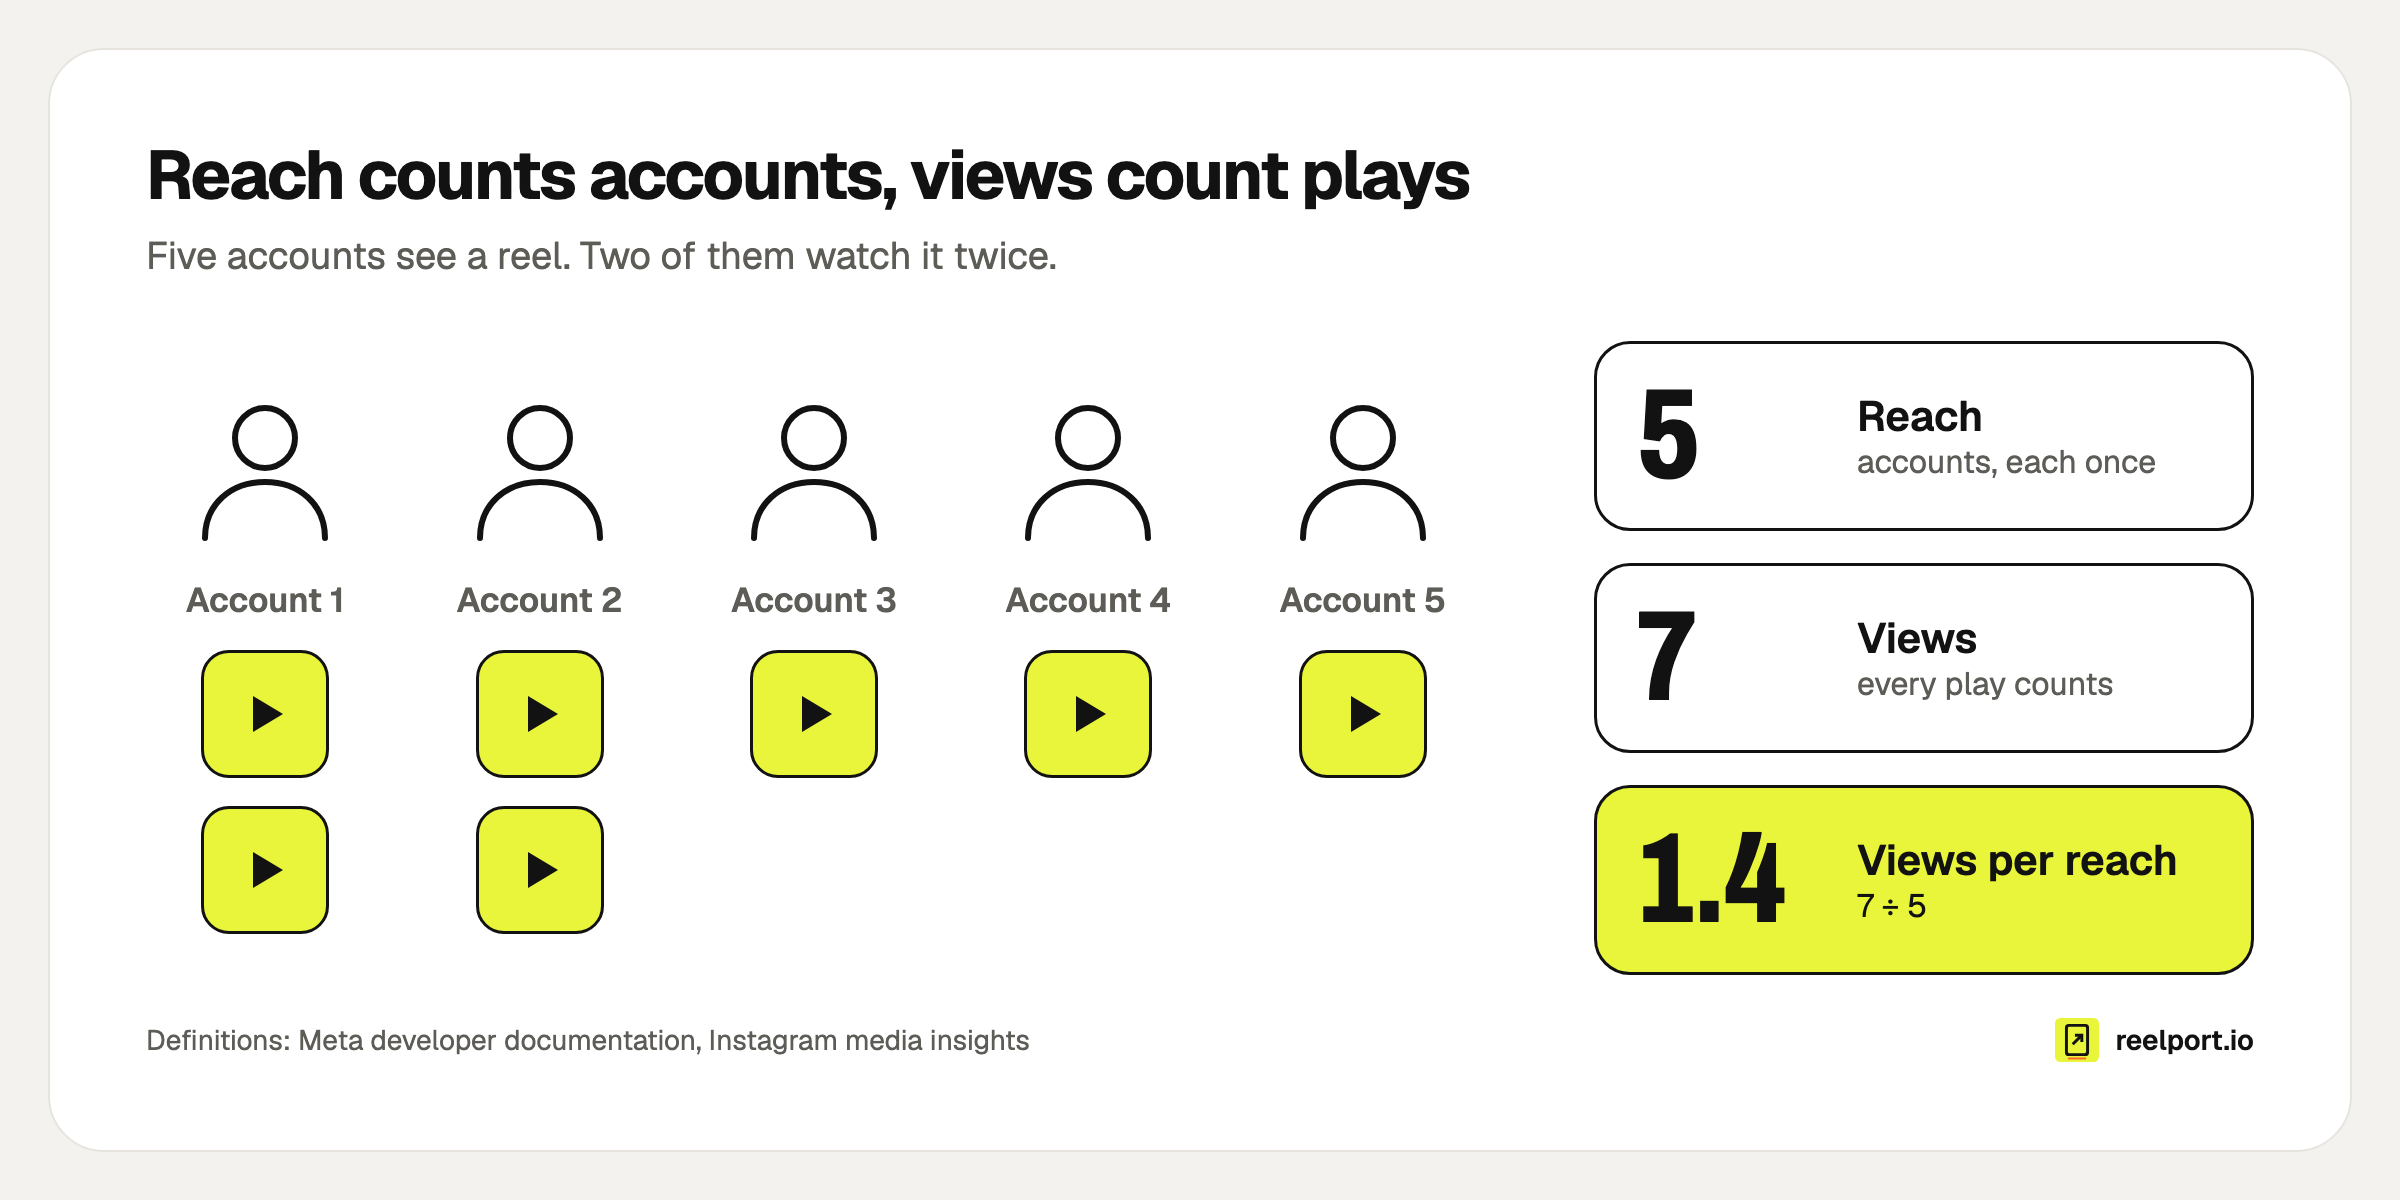
Reach counts each account once; views count every play.
What happened to impressions?
Impressions are gone for new posts. Meta's documentation marks the metric as deprecated for media created after July 2, 2024, and at account level it was removed on April 21, 2025, with views named as the replacement. Older posts keep their impressions, so a year-on-year comparison of the two does not line up.
If a report template or a client brief still asks for impressions, replace the line with views and say so in a footnote. Treat them as two separate metrics and do not draw a trend line through the switch.
How do you calculate engagement rate and the per-reach rates?
Divide each interaction by reach and multiply by 100. Engagement rate by reach is total interactions ÷ reach × 100. Meta's documentation defines no engagement rate, so the formula is a convention: pick one, write it on the report and never change it between months.
The six formulas:
- Engagement rate = (likes + comments + saves + shares) ÷ reach × 100
- Likes per reach = likes ÷ reach × 100
- Saves per reach = saves ÷ reach × 100
- Shares per reach = shares ÷ reach × 100
- Views per reach = views ÷ reach
- Watched share = average watch time ÷ reel length × 100
Reach is the better denominator than followers, because a reel is shown to many people who do not follow you. Dividing by followers punishes exactly the posts that travelled furthest.
Here is a worked example. Studio Nordlicht is an invented pottery studio, and these numbers are made up to show the arithmetic.
| Reel A (24 seconds) | Reel B (30 seconds) | |
|---|---|---|
| Views | 11,760 | 25,200 |
| Reach | 8,400 | 21,000 |
| Likes | 504 | 630 |
| Comments | 38 | 21 |
| Saves | 210 | 105 |
| Shares | 126 | 84 |
| Average watch time | 9.5 seconds | 4.2 seconds |
| Skip rate | 31% | 58% |
On raw totals Reel B wins: more than twice the views, more likes. Now the rates:
| Reel A | Reel B | |
|---|---|---|
| Engagement rate | 878 ÷ 8,400 = 10.5% | 840 ÷ 21,000 = 4.0% |
| Likes per reach | 504 ÷ 8,400 = 6.0% | 630 ÷ 21,000 = 3.0% |
| Saves per reach | 210 ÷ 8,400 = 2.5% | 105 ÷ 21,000 = 0.5% |
| Shares per reach | 126 ÷ 8,400 = 1.5% | 84 ÷ 21,000 = 0.4% |
| Views per reach | 11,760 ÷ 8,400 = 1.4 | 25,200 ÷ 21,000 = 1.2 |
| Watched share | 9.5 ÷ 24 = 40% | 4.2 ÷ 30 = 14% |
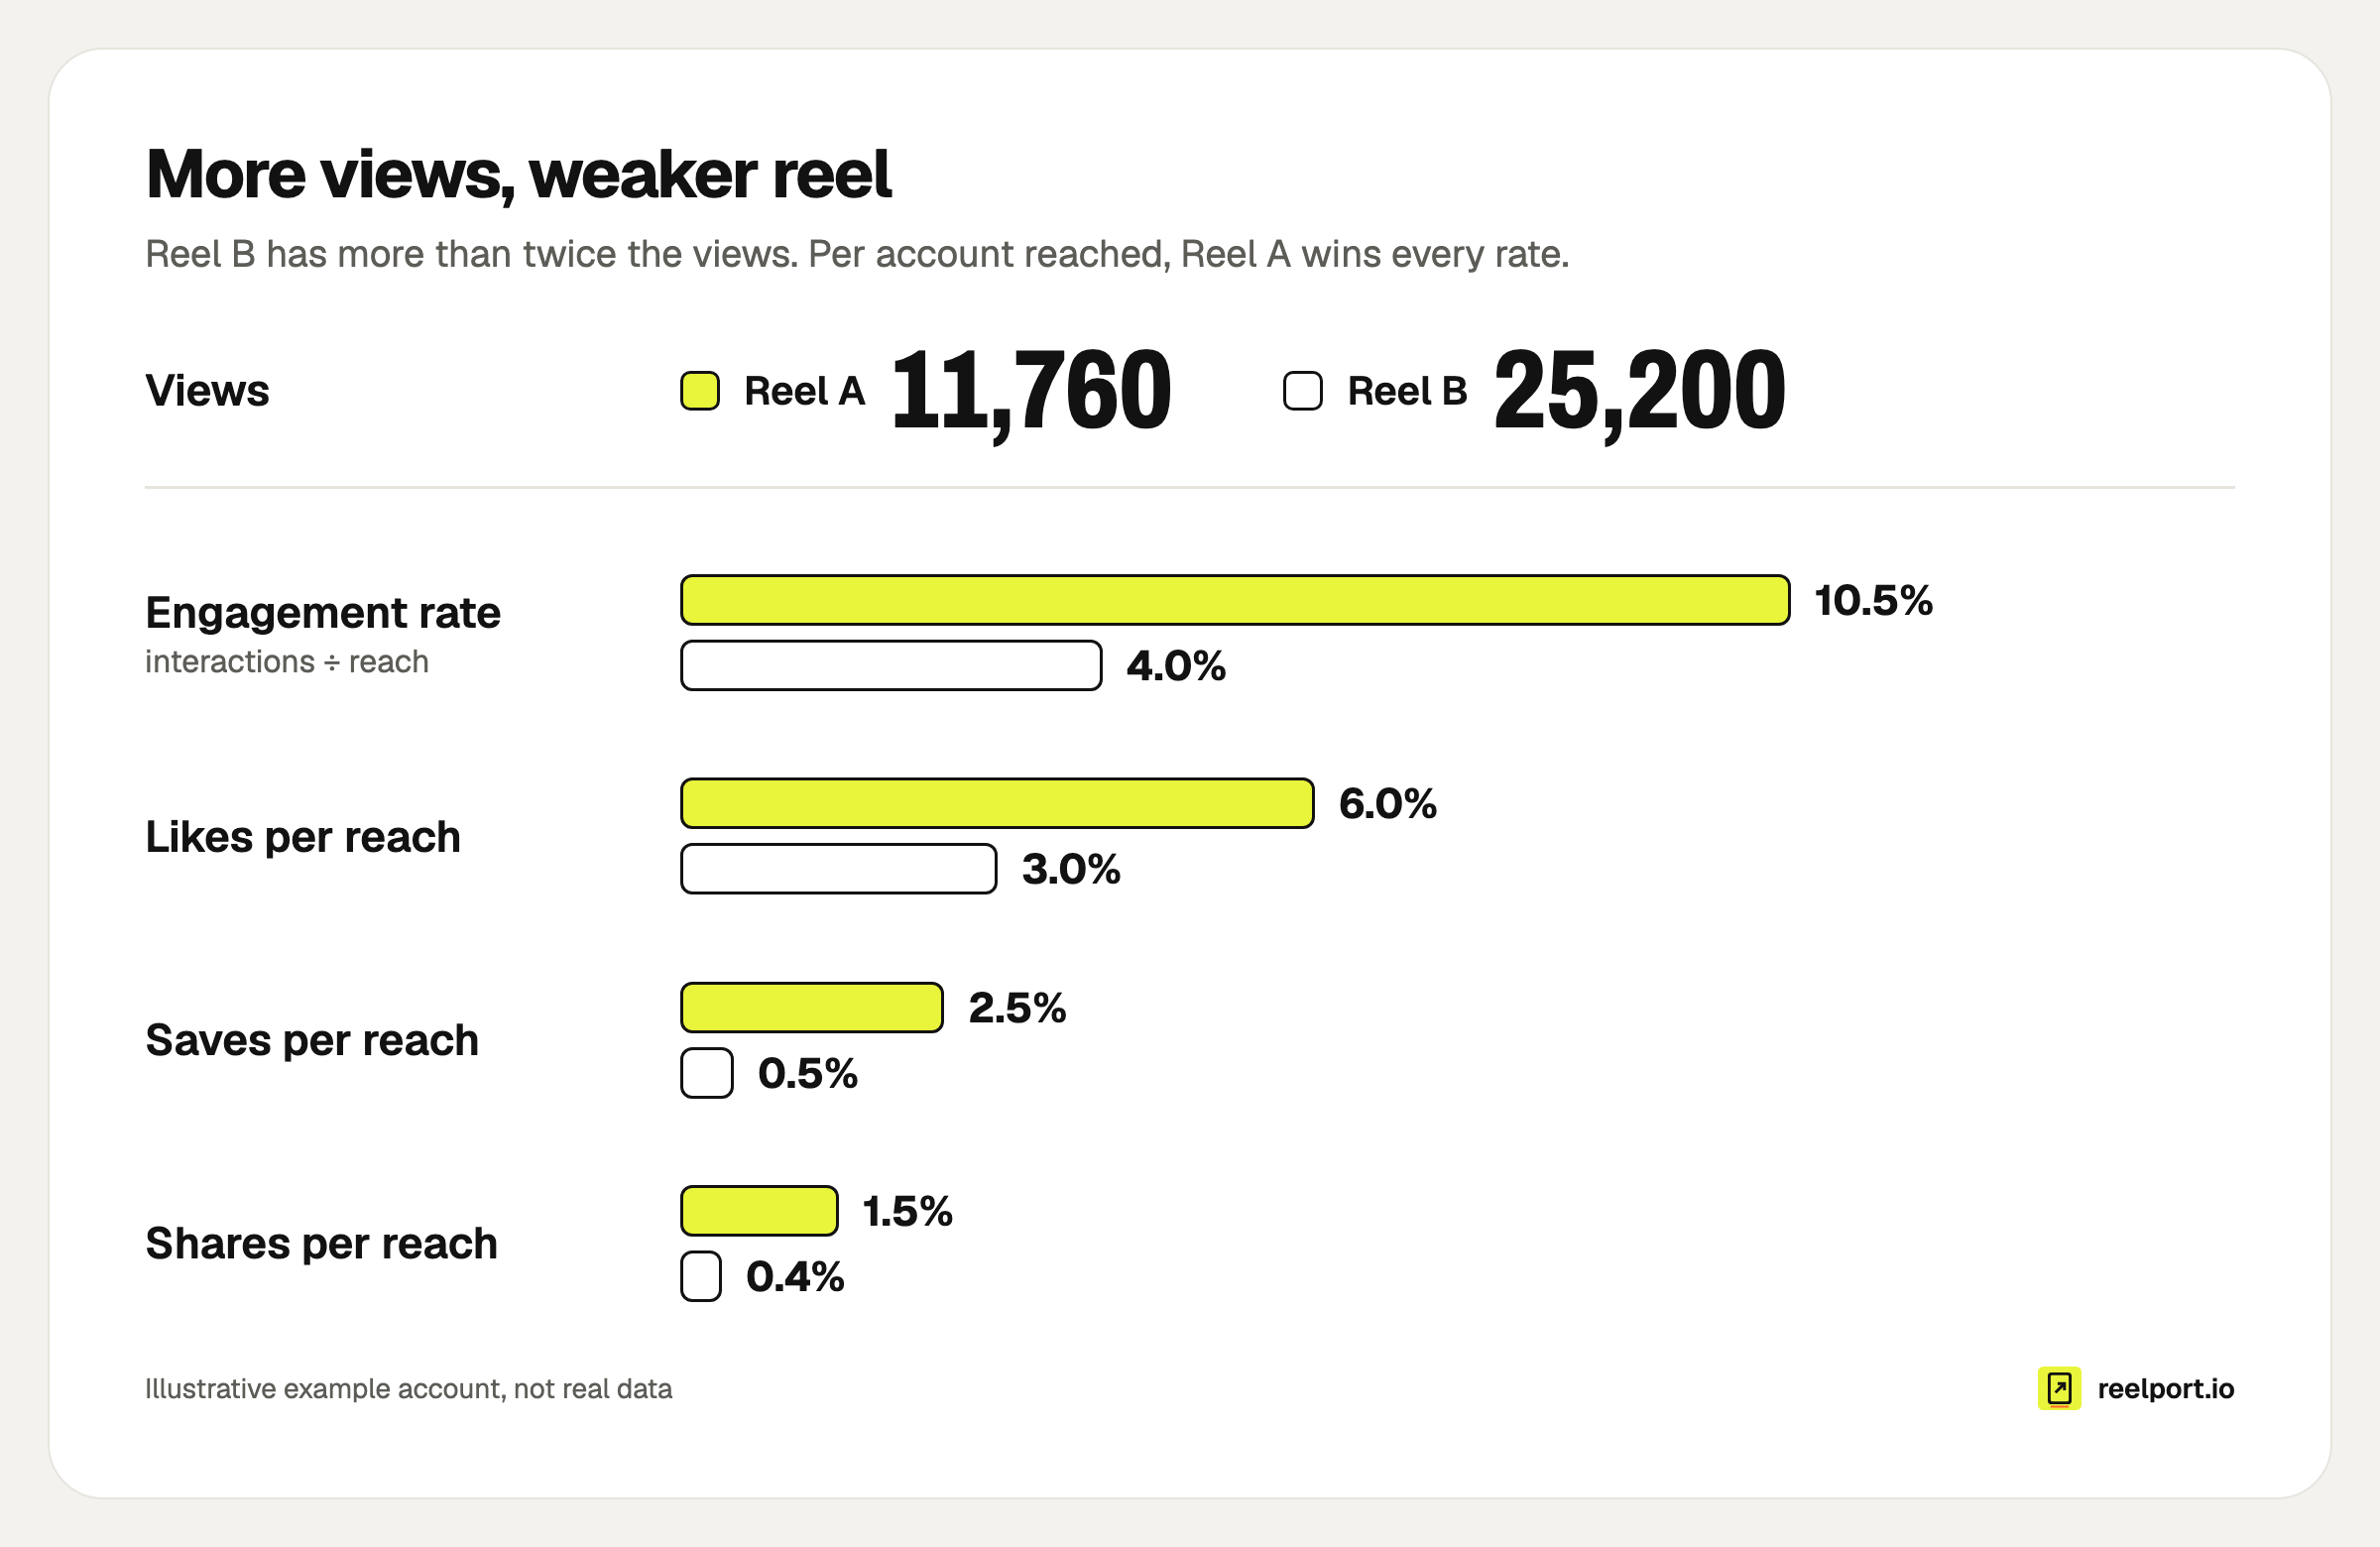
Reel B was shown to more accounts; Reel A did more with each one.
Reel B was distributed widely and then ignored: 58% of first views were skipped within three seconds and the average viewer saw 14% of it. Reel A is the one to make again. Its topic, opening and length are the brief for next week.
What is a good number for each metric?
A good number is one above your own median. Benchmarks from other accounts mix niches, sizes and formats, and Meta's documentation gives none. Your last ten to twenty posts of the same format are the fairest comparison, because they share your audience, your topics and your production level.
To set your baseline:
- Export or copy the last ten reels with reach and the interactions.
- Calculate the six rates for each.
- Sort each rate and take the middle value. With ten posts, that is the average of the fifth and sixth.
- Mark every new post as above or below the median, per rate.
Use the median rather than the average. One reel that took off pulls the average up so far that every normal post looks like a failure. Recalculate once a month, and keep reels, carousels and stories in separate baselines.
What should you change when a metric is low?
Each rate points at a different part of the post. Skip rate judges the first three seconds, watched share the middle, saves and shares the usefulness, and follows or profile visits what happens after. Find the rate that is below your median and change that part only, so the next post tells you whether it worked.
| What you see | What it usually means | What to change next |
|---|---|---|
| Skip rate above your median | The opening did not earn the watch | Start on the result or on movement, cut logo intros, put the promise in on-screen text in the first frame |
| Skip rate fine, watched share low | The middle drags or the reel is too long for the idea | Cut a third of the length, move the payoff earlier |
| Views per reach close to 1.0 | Nobody watched twice | Shorten it, or end where the start picks up so it loops |
| High reach, low likes per reach | It reached people outside your usual audience and did not land | Check the topic against your best posts before you repeat it |
| Saves high, shares low | Useful to keep, not something people send | Add the line that makes someone think of a friend, or frame it for a specific person |
| Shares high, follows and profile visits low | People pass it on without caring who made it | Name yourself in the first seconds and fix the bio and pinned posts |
| Reach falling across several posts | Recommendations may be limited | Check Account Status in the app, and upload clean files without another app's watermark |
| Story reach drops from frame to frame | People leave mid-sequence | Read navigation: put the important frame first and shorten the sequence |
These readings are rules of thumb; Meta's documentation makes none of these claims. They hold up when you change one thing at a time. Posting time is a separate lever, covered in how to find your best time to post on Instagram.
Why are some Instagram numbers missing or different between tools?
Most gaps come from limits Meta documents. Numbers can lag by up to 48 hours, reach and skip rate are estimates, story metrics exist for 24 hours only, and several metrics need a minimum audience. A tool can only show what Instagram hands over, at the moment it last asked.
The limits, from Meta's media insights and account insights documentation:
- Delay. Insights data can be up to 48 hours behind. Do not judge a post on day one.
- Stories. Metrics are available for 24 hours, and a story metric with a value below 5 returns an error instead of a number.
- Small accounts. Follower demographics and follows and unfollows are not returned below 100 followers.
- Demographics. Only the top 45 values are returned, and only viewers with demographic data are counted, so the parts can add up to less than your follower count.
- Carousels. There are no insights for the single slides inside a carousel, only for the post as a whole.
- History. Post metrics are stored for up to 2 years.
- Ads. Likes, comments, views and total interactions on a post exclude ad activity, while account-level reach includes it.
- Account type. Meta's API returns insights for professional accounts only, which means Creator or Business. Inside Instagram, the Help Center says any public account, personal or professional, can view insights.
When two tools disagree, compare the time each one last synced before you suspect an error. A number read on Monday morning and one read on Tuesday evening are both right.
A weekly review template you can copy
Ten minutes, once a week, same day. Put the columns in a spreadsheet and the questions in your notes.
COLUMNS (one row per post)
Date | Format | Topic | Length (s) | Reach | Views | Likes | Comments |
Saves | Shares | Avg watch time (s) | Skip rate

CALCULATED COLUMNS
Engagement rate   = (Likes + Comments + Saves + Shares) / Reach
Likes per reach   = Likes / Reach
Saves per reach   = Saves / Reach
Shares per reach  = Shares / Reach
Views per reach   = Views / Reach
Watched share     = Avg watch time / Length

WEEKLY QUESTIONS
1. Which post beat my median on the most rates? What was its topic,
   opening and length?
2. Which post had the highest skip rate? What were its first 3 seconds?
3. Which post had reach above normal but rates below? Do I repeat that
   topic or drop it?
4. One thing I change next week: ______
5. One thing I repeat next week: ______

RULES
- Read a post's numbers no earlier than 48 hours after publishing.
- Compare reels with reels, carousels with carousels.
- Recalculate medians on the first of the month.
Where reelport.io fits
Insights in reelport.io lists views, reach, likes, comments, shares, saves and average watch time for up to 200 posts in one sortable table, with totals compared against the previous period of the same length. Numbers sync twice a day, and new posts are checked every 30 minutes for their first six hours. A CSV export gives you the columns for the template above, and PDF reports can be emailed weekly or monthly.
Instagram history is back-filled when you connect the account, and you can follow other Instagram Business and Creator accounts to compare their public numbers with yours. Insights also feeds the Contentplanner, which builds plans on what worked for you. Insights is part of the paid plans, from Creator at $19 a month, showing the last 365 days on Creator and 730 days on Pro and Agency; the 14-day Pro trial needs no card. See pricing and what the Instagram channel covers.